
 Discover how you can quickly create a nice looking organisation chart with iMindMap from ThinkBuzan. The tool will also allow you to present your charts and store them centrally. Throughout my explanations, I will highlight the different features you will use in order to get a professional result.

I must admit that conventionally we use poor organisational chart diagram in order to present the composition of a team, a department or even a company. On the market, you will easily find software’s that support this type of diagram. If you plan to use iMindMap or if you are already using it, this application can support the diagram as well. The easiest approach is to build the diagram from left to right instead of bottom to top. Indeed, from a mind map perspective, it’s easier to connect texts at the right (or left) of the central idea. Let me explain you how to exploit one by one some of the key features of the application (you can find here a full list of iMindMap features and details).
Box Branches and “Speed Mind Map”
In a standard organisation chart, elements are usually represented by boxes. In order to create your mind map with such boxes, you can use box branch. This branch type has also the advantage of supporting multi-lines. If you need to type both the team name and its leader for instance, it’s possible by adjusting the box width accordingly. You can also force the return line feed with <CTRL> + <ENTER> inside the box.
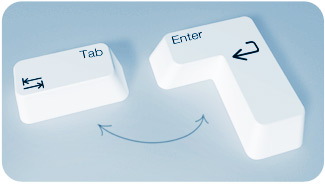 Because the layout is secondary at this stage, you should focus first on the content. Your central idea represents the top of the organisation you are drawing. With the “speed mind map” mode, you will create your chart in just a few seconds. By exclusively using the keyboard, enter the hierarchy of people. If you want to create a child box branch, hold the <SHIFT> key and press the <TAB> one. If you want to create another branch at the same level (when entering team members for instance), hold the <SHIFT> key and press the <ENTER> one as many times as needed.
SmartLayout and Clean Up

In order to get your mind map quickly and automatically re-arranged, you can use the Clean up feature. It’s in the Format->Layout menu. The software will use the SmartLayout settings and will apply it to all your branches, delivering a clear and well formatted diagram.
Control Points, Branch Pins and Expand/Collapse
If you don’t like the branches radiating around the central idea, I propose that you use the first control point of each main branch and drag it outside the box at mid-height. You will flatten the first level of branches and the diagram will look more like an organisation chart.

You will also notice the +/- icon on your branches. It allows you to expand and collapse the underlying level of branches. This can be very useful especially when you have modeled a big department with many teams and members. You can hide the Expand&Collapse icon (and several others) with the View->Show & Hide menu.
Styles
Using the Design menu, you will benefit from additional functionalities that will enhance the look and feel of your chart. You can use predefined layout but this can damage the layout you have already put in place. Instead you can adapt several dimensions using the top right menu. Indeed, you can change the Font option (e.g. Calm), the Colours scheme (e.g. Decorous) and the Graphics style (e.g. Fun, which will increase the width of your branch and drop a shadow). If you want, you can also create and save your own options in each of the category.

Now that your chart is finished, why not adding some pictures to it. The box branch supports an embedded sketch. I recommend that you prepare member's photos outside iMindMap, using another editor. Once your photos are ready, ideally with a consistent shape and format, you can simply paste them on the different boxes. You can also edit the central idea picture in case you need to add photo there as well. To do so, you will select the central idea and use the Insert->Sketch menu.
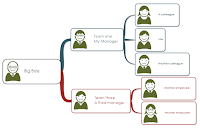
 |
| Organisation chart with iMindMap |
Why not using the limitless workspace within iMindMap to manage several departments and teams simultaneously and still maintain the clarity and ‘whole picture’ effect. Your maps can be as elaborate and as large as you decide because you can create as many central ideas on your canvas as you wish.

Relationships can also come in very handy when you’re working with MultiMaps, acting as an anchor between connected maps. You can document your organisation with high level views and more detailed ones, using relationships for navigating among the different levels or divisions of your company.
Presentation view

ThinkBuzan Cloud (Beta)
Organisation charts are typical assets that evolve in time. Ideally, it should be stored and accessed centrally. You can simply save your diagrams in the secure ThinkBuzan Cloud and you will be able to access them from iMindMap desktop or iMindMap Online on any other computer. Once safely tucked in the ThinkBuzan Cloud your maps will be automatically synced whenever you work on them.
As you can see, iMindMap proposes many features for designing and maintaining professional diagrams. A mind map is not an organisation chart but reversely, you can draw such a diagram with a mind map tool. Let me know if you tried yourself. Share your experiences and comments with me and others here on the blog.
Discover how you can quickly create a nice looking organisation chart with iMindMap from ThinkBuzan. The tool will also allow you to present your charts and store them centrally. Throughout my explanations, I will highlight the different features you will use in order to get a professional result.
I must admit that conventionally we use poor organisational chart diagram in order to present the composition of a team, a department or even a company. On the market, you will easily find software’s that support this type of diagram. If you plan to use iMindMap or if you are already using it, this application can support the diagram as well. The easiest approach is to build the diagram from left to right instead of bottom to top. Indeed, from a mind map perspective, it’s easier to connect texts at the right (or left) of the central idea. Let me explain you how to exploit one by one some of the key features of the application (you can find here a full list of iMindMap features and details).
Box Branches and “Speed Mind Map”
In a standard organisation chart, elements are usually represented by boxes. In order to create your mind map with such boxes, you can use box branch. This branch type has also the advantage of supporting multi-lines. If you need to type both the team name and its leader for instance, it’s possible by adjusting the box width accordingly. You can also force the return line feed with <CTRL> + <ENTER> inside the box.
Because the layout is secondary at this stage, you should focus first on the content. Your central idea represents the top of the organisation you are drawing. With the “speed mind map” mode, you will create your chart in just a few seconds. By exclusively using the keyboard, enter the hierarchy of people. If you want to create a child box branch, hold the <SHIFT> key and press the <TAB> one. If you want to create another branch at the same level (when entering team members for instance), hold the <SHIFT> key and press the <ENTER> one as many times as needed.SmartLayout and Clean Up
In order to get your mind map quickly and automatically re-arranged, you can use the Clean up feature. It’s in the Format->Layout menu. The software will use the SmartLayout settings and will apply it to all your branches, delivering a clear and well formatted diagram.
Control Points, Branch Pins and Expand/Collapse
If you don’t like the branches radiating around the central idea, I propose that you use the first control point of each main branch and drag it outside the box at mid-height. You will flatten the first level of branches and the diagram will look more like an organisation chart.
You will also notice the +/- icon on your branches. It allows you to expand and collapse the underlying level of branches. This can be very useful especially when you have modeled a big department with many teams and members. You can hide the Expand&Collapse icon (and several others) with the View->Show & Hide menu.
Styles
Using the Design menu, you will benefit from additional functionalities that will enhance the look and feel of your chart. You can use predefined layout but this can damage the layout you have already put in place. Instead you can adapt several dimensions using the top right menu. Indeed, you can change the Font option (e.g. Calm), the Colours scheme (e.g. Decorous) and the Graphics style (e.g. Fun, which will increase the width of your branch and drop a shadow). If you want, you can also create and save your own options in each of the category.
Now that your chart is finished, why not adding some pictures to it. The box branch supports an embedded sketch. I recommend that you prepare member's photos outside iMindMap, using another editor. Once your photos are ready, ideally with a consistent shape and format, you can simply paste them on the different boxes. You can also edit the central idea picture in case you need to add photo there as well. To do so, you will select the central idea and use the Insert->Sketch menu.
|
| Organisation chart with iMindMap |
Why not using the limitless workspace within iMindMap to manage several departments and teams simultaneously and still maintain the clarity and ‘whole picture’ effect. Your maps can be as elaborate and as large as you decide because you can create as many central ideas on your canvas as you wish.
Relationships can also come in very handy when you’re working with MultiMaps, acting as an anchor between connected maps. You can document your organisation with high level views and more detailed ones, using relationships for navigating among the different levels or divisions of your company.
Presentation view
ThinkBuzan Cloud (Beta)
Organisation charts are typical assets that evolve in time. Ideally, it should be stored and accessed centrally. You can simply save your diagrams in the secure ThinkBuzan Cloud and you will be able to access them from iMindMap desktop or iMindMap Online on any other computer. Once safely tucked in the ThinkBuzan Cloud your maps will be automatically synced whenever you work on them.
As you can see, iMindMap proposes many features for designing and maintaining professional diagrams. A mind map is not an organisation chart but reversely, you can draw such a diagram with a mind map tool. Let me know if you tried yourself. Share your experiences and comments with me and others here on the blog.

One more great tutorial, thanks Philippe
ReplyDeleteThank you Frederic. I'm happy you like it.
DeleteThanks Philippe, really enjoyable read and great demonstration of iMindMap as always.
ReplyDeleteIt's not easy to keep the momentum but it's great to see how you are all supporting me. Thanks
DeleteExcellent work as always, Thank you for sharing your wonderful ideas with us :)
ReplyDeleteYes, great job indeed. Well explained. Thank you Philippe :)
ReplyDeleteNice work .... again :)
ReplyDelete@Sally @Olivier @Hanne. Thanks.
ReplyDeleteHi Phiippe, This is an excellent article and and I just came across it at the right time as I need to do an organisational chart.
ReplyDeleteThank you so much.
Many Thanks Philippe,
ReplyDeleteGreat focus for this organisational chart. True that iMindMap is so powerfull for breaking barriers visible or not. And for that, no need to sacrify organic or fonctional view ! So great. Denys.
Great work has been done here regarding organisation charts, exact demonstrations so far.
ReplyDeleteGood article with many good usage tips. I'm probably just blind, but how did you make the central idea a box branch?
ReplyDeleteThank you. If you don't find the white box in the central images library, you can simply create a box of your choice (color outline, shadow, ...) with white fill in any other drawing or office tool (ex: PowerPoint), copy it, select the central idea of your map and paste it onto it. Then, type you central idea text. Hope it helps.
DeletePhil
Very interesting post! I recommend you to change your diagrams design. Try something from http://charts.poweredtemplate.com/powerpoint-diagrams-charts/index.html to make it cool! Good luck!
ReplyDelete