 Version française
 The Tour the France 2012 started on June 30th, from Liège in Belgium. Discover a new interactive map (of France) and creative mind maps detailing the characteristics of the stages. It combines the drawing flexibility of iMindMap software and the power of online tagging with ThingLink tool.
I'm living in the Province Liège (Belgium) which launches the 2012 Tour de France. It is with unfeigned delight and pride that, following up the success of 2004, the Province once again hosts the grand start of the Tour.
The Tour de France is an annual bicycle race held in France and nearby countries. As the best known and most prestigious of cycling's three "Grand Tours", the Tour de France attracts riders and teams from around the world. The race is broken into day-long segments, called stages. Individual times to finish each stage are aggregated to determine the overall winner at the end of the race. The course changes every year, but the race has always finished in Paris, along the Champs-Élysées (Wikipedia).
Running from Saturday June 30th to Sunday July 22th 2012, the 99th Tour de France will be made up of 1 prologue and 20 stages and will cover a total distance of 3,497 kilometres.
This important event taking place in my region is a new opportunity for me to use iMindMap and ThingLink tools in order to design an interactive map, and detailed mind maps for stages. Following Patrick Zimbardo's idea who used a mind map for giving results about EURO2012 football matches (see Patrick's mind map), I plan to update each mind map with the results of the day, during the time of the Tour.
You can download the iMindMap file on Biggerplate plateform.
I truly believe that creative mind maps provide new ways of communicating useful information, whether it is for giving the big picture or going into the details. The stage mind map will inform you about the date, the distance, the profile (mountain passes, hills, intermediate sprint), the start and finish towns and once known, the 3 first cyclists crossing the finish line. I also invite you to read Am I drawing true mind maps? where you will find another creative mind map describing the route and the profile of a specific stage.
Further to the recent success of the first interactive mind map with ThingLink, I wanted to use once again this fantastic image tagging tool. I used iMindMap, the mind map tool from ThinkBuzan, to re-create the entire route of the Tour de France 2012. The software is extremely flexible and I've been able to draw the route with a true mind map (which you can eventually discover step by step with the presentation mode). I have already used the technique for drawing the timeline or the dot-to-dot game. On top of the image, I placed a ThingLink tag for each stage of the race. If you move your mouse over the route of a stage, you will expand the corresponding mind maps, which will give you the characteristics. Along the tour, the interactive image will also give you access to the main standings (individual, points and climber) and to the official website (www.letour.fr)
Click here if you want to access a larger version of the interactive map.
I hope you will enjoy this new creative mind map and its interactivity. Whether you like sport or not, the objective of this article is essentially to show the power of iMindMap combined with ThingLink in order to communicate information in an attractive and efficient way.
Do not hesitate to share your own experiences with the tools. You are also welcome to ask questions about the technique, start discussions about the topic, give some feedback or contact me via the different channels for your requests or any additional information.
The Tour de France is an annual bicycle race held in France and nearby countries. As the best known and most prestigious of cycling's three "Grand Tours", the Tour de France attracts riders and teams from around the world. The race is broken into day-long segments, called stages. Individual times to finish each stage are aggregated to determine the overall winner at the end of the race. The course changes every year, but the race has always finished in Paris, along the Champs-Élysées (Wikipedia).
Running from Saturday June 30th to Sunday July 22th 2012, the 99th Tour de France will be made up of 1 prologue and 20 stages and will cover a total distance of 3,497 kilometres.
This important event taking place in my region is a new opportunity for me to use iMindMap and ThingLink tools in order to design an interactive map, and detailed mind maps for stages. Following Patrick Zimbardo's idea who used a mind map for giving results about EURO2012 football matches (see Patrick's mind map), I plan to update each mind map with the results of the day, during the time of the Tour.
 |
| Tour de France 2012 - Stage - Mind Map Overview with iMindMap |
I truly believe that creative mind maps provide new ways of communicating useful information, whether it is for giving the big picture or going into the details. The stage mind map will inform you about the date, the distance, the profile (mountain passes, hills, intermediate sprint), the start and finish towns and once known, the 3 first cyclists crossing the finish line. I also invite you to read Am I drawing true mind maps? where you will find another creative mind map describing the route and the profile of a specific stage.
Further to the recent success of the first interactive mind map with ThingLink, I wanted to use once again this fantastic image tagging tool. I used iMindMap, the mind map tool from ThinkBuzan, to re-create the entire route of the Tour de France 2012. The software is extremely flexible and I've been able to draw the route with a true mind map (which you can eventually discover step by step with the presentation mode). I have already used the technique for drawing the timeline or the dot-to-dot game. On top of the image, I placed a ThingLink tag for each stage of the race. If you move your mouse over the route of a stage, you will expand the corresponding mind maps, which will give you the characteristics. Along the tour, the interactive image will also give you access to the main standings (individual, points and climber) and to the official website (www.letour.fr)
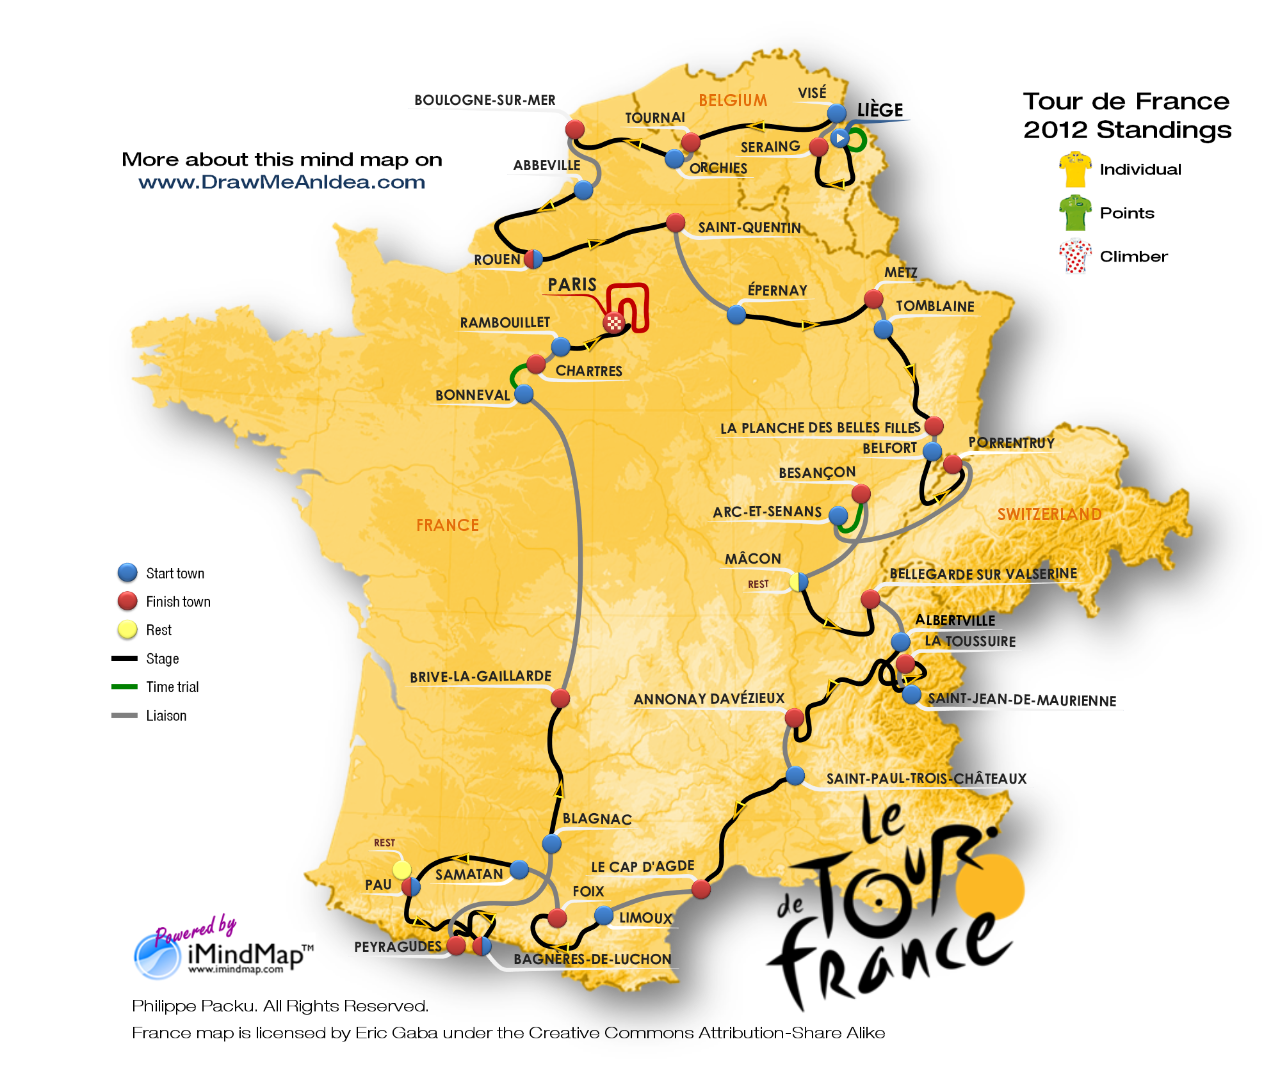 |
| Tour de France 2012 - Route - Interactive Mind Map with Thinglink |
Click here if you want to access a larger version of the interactive map.
I hope you will enjoy this new creative mind map and its interactivity. Whether you like sport or not, the objective of this article is essentially to show the power of iMindMap combined with ThingLink in order to communicate information in an attractive and efficient way.
Do not hesitate to share your own experiences with the tools. You are also welcome to ask questions about the technique, start discussions about the topic, give some feedback or contact me via the different channels for your requests or any additional information.







 I have two children, two boys. Corentin is the youngest and is 5 years old. The eldest, Baptiste, is 8 years old. Like many other children of this age, the most important thing during the day is PLAYING. They like to play individually or together, with balls, board games, game consoles and they also like to watch TV. But of course, like any other kid, they also have some difficulties keeping their bedrooms tidy, they are a bit lazy in studying and their participation in household chores is quite limited except when asked.
  This situation was becoming extremely stressful for both parties. Indeed, it demands a huge amount of energy to check every time if the status is green. It’s particularly stressful to engage with the two boys in the middle of their game, because they will automatically react negatively, considering the intervention unfair, unjustified or inappropriate (especially if they were authorized to play earlier). Although we were usually getting things finally done, it was systematically creating a bad atmosphere, with cries and tears. Worse, we were feeling somehow guilty because we were always stopping and preventing our children from enjoying, trying to remain consistent with the rules we introduced.



